


Moran Lake Water Quality Study & Conceptual Restoration Plan
4.1. Overview
Eutrophic and hyperhaline conditions in Moran Lake have been well documented since the mid 1970’s. Several factors are contributing to this, including poor circulation and flushing during the summer months and nutrient rich runoff entering the lagoon from urbanized lands.
Historical and recent testing continue to detect high concentrations of fecal coliform bacteria indicating the lagoon is receiving contaminated runoff from the surrounding urbanized areas. Although historic testing may have indicated sewage overflows from the treatment plant that once existed at Lode Street, it is likely that present coliform contamination comes from multiple sources, including domestic animals, leaking sewers, and wildlife (most notably water fowl) residing in the lagoon or riparian corridor.
A reduction in lagoon surface area and volume has diminished the ability of Moran Lake to dilute and assimilate contaminants.
Eutrophic or highly enriched watercourses, such as Moran Lake show highly varying levels of dissolved oxygen (DO). During early morning periods DO is suppressed with low concentrations, while in the late afternoon DO may be very high due to algae and other aquatic vegetation releasing oxygen into the water column. Urban pollution and storm water runoff act to decrease dissolved oxygen concentrations in lake water. Polluted runoff containing degradable organic matter introduced to a water body such as Moran Lake, exert an oxygen demand during the assimilation and decomposition of these waste products. This oxygen demand can deplete DO concentrations, creating unsuitable conditions for aquatic organisms.
General mineral analyses conducted in June, July and October 2004 clearly indicate that during the summer months the lagoon is filled primarily with salt water and the major ions in solution include chloride and sodium. During the first flush event, the water condition in the lagoon shifted rapidly to freshwater.
The concentration of trace metals varied significantly both spatially and seasonally. During the summer months the trace metals concentration was very low. However, the highest concentrations during this period were routinely detected in the samples collected from Moran Creek which receives dry weather runoff from urbanized areas. Dry weather runoff includes runoff from streets and driveways, construction- related washing activities, car washing, and over spray from landscape irrigation systems. A sample collected in late October during the first significant rainfall event ("first flush" event) contained significantly higher concentrations of these metals, which could adversely affect aquatic organisms. Comparing the test results to the different water quality criteria indicate that during the first flush event, the three metals tested were measured at concentrations that exceed several water quality criteria. The test results indicate that runoff from urbanized areas in the watershed discharge significant and potentially toxic levels of copper and zinc to Moran Lake.
Sediment samples detected the presence of several polyaromatic hydrocarbons (PAHs), commonly known as oils and grease. Principal sources of PAHsare roads, parking lots and vehicle service areas. Several of the PAH compounds detected are carcinogenic compounds and other compounds are potentially toxic to aquatic life. Comparing the PAH concentrations with different sediment quality benchmarks indicate that the phenanthrene, chrysene, benzo(a)anthracene and benzo(a)pyrene exceed criteria established by the British Columbia Ministry of Water, Land and Air Protection for protection of freshwater organisms. The total concentrations of PAHs is elevated, but are below the low and median effects levels established by the National Oceanic and Atmospheric Agency (NOAA). Based on the more conservative and contaminant specific criteria established by British Columbia, the levels of PAHs detected in the sediment may be impairing benthic and other aquatic life in the lagoon. Sediment test results detected total chlordane levels well above the probable and threshold effects levels established by several agencies. The results indicate that the residual and persistent chlordane levels in lagoon sediments may adversely affect aquatic life in the lagoon.
The following chapter provides a review of historical and recent water quality studies of Moran Lake, and the results of water quality and sediment testing undertaken as part of this study.
4.2. Review of Historical Water Quality Studies and Monitoring Activities
Staff Report on Moran Lake, 1976 (prepared by S. Singer and R. Aston)
Santa Cruz County Watershed Management staff conducted a water and sediment quality assessment of Moran Lake in 1976. The assessment provided a description of the watershed and the lagoon. The study also included a summary of summer field observations conducted on three separate occasions through the summer months. Two rounds of water quality and one round of sediment testing were performed as part of the study. Urban runoff loading calculations were also completed to estimate the amount of pollutants that could potentially enter the lagoon. The study concluded that there were two major water quality issues: (1) poor circulation and flushing during the summer months leading to euthrophic and hyperhaline conditions, and (2) urban development in the Moran Lake watershed that changed the amount, timing, and quality of surface runoff entering the lagoon. The report noted relatively high levels of nutrients, fecal coliform, oil and grease and heavy metals in the lagoon. Several alternative "corrective measures" are presented, including installing and maintaining a channel to "improve tidal flushing" and replacing the previous culvert with a bridge (The culvert was replaced with the present box culvert in 1981). The study also recommended ongoing summer maintenance to maintain the outlet channel open throughout the summer; installation of a tidal gate to prevent tidal flushing into the lagoon to maintain lower salinity levels in the lagoon; reshaping the lake by removing some of the fill material to try and improve mixing and flushing action; initiating public education efforts to reduce pollutant levels in runoff entering the lagoon; and finally, installing a treatment system for urban stormwater runoff.
Environmental Baseline Study for the Moran Lake Enhancement Plan, 1980 (prepared by G. Stern and P. Courter)
During the spring of 1980, the first phase of the Moran Lake Enhancement Plan was undertaken and summarized in this report. The study was sponsored by the California Coastal Conservancy, and was conducted to evaluate biological abundance and diversity in relation to sediment and water quality. Water quality testing was performed from November 1979 to February 1980 in several coastal lagoons, including Moran Lake, Corcoran and Schwan Lagoons. Water quality results showed an increase in nutrients attributed to storm water runoff in Moran Lake. The results of the study also indicated that the lake or lagoon had a "diminished capacity for handling nutrient loads". Fecal coliform levels in Moran Lake were higher than in neighboring Corcoran, which was attributed to the "restricted exchange between the lagoon and ocean". The high fecal coliform counts and nutrients were interpreted as signs of eutrophication. The results of the sediment sampling showed decreased levels of lead, chromium, and cadmium in Moran Lake as compared with the 1976 County study. A decrease in lead concentration was attributed to the use of unleaded gasoline, or removal of debris from the lake by community groups, which may have also removed other possible sources of metal contamination.
Santa Cruz County Environmental Health Monitoring Activities
The Santa Cruz County Environmental Health Agency has conducted periodic water quality testing at several locations in the Moran Lake watershed, including up and down stream of East Cliff Drive, at 30th Avenue, the 38th Avenue Stormwater Detention Basin, and at the intersection of 38th Avenue and Brommer Street. From 1976 through 1980 the County performed several tests at the 38th Avenue detention basin primarily for total suspended solids, turbidity and fecal coliform bacteria. The results routinely detected elevated levels of fecal coliform in Moran Creek. From 1979 through 1992 the County conducted field measures in the Lagoon for temperature, pH, conductivity and dissolved oxygen. During this period water samples were also collected from the lagoon and analyzed for general minerals, fecal coliform bacteria and trace metals. Field measurements and general mineral concentrations are very similar to results obtained during this study effort and indicate that the lagoon water quality is quite variable seasonally but relatively constant from year to year. Limited tests for metals detected elevated levels of chromium and lead in the early 1980’s.
2003 Technical Summary: Comparative Lagoon Ecological Assessment Project (prepared by Swanson Hydrology and Geomorphology)
The Comparative Lagoon Ecological Assessment project is a phased 3-year project (2003-2006) funded by the California Coastal Conservancy and administered by the Santa Cruz County Resource Conservation District. A key goal of the study includes documenting the existing water quality, physical and ecological conditions of Santa Cruz County lagoons. In 2003, data collections efforts were undertaken to compare an array of physical, chemical and vegetation data from 11 lagoons on the Central Coast, including Moran Lake. The comparative information was used to generally assess the physical alterations and current land use pressures associated with the quality of each lagoon system, and evaluate the relative nutrient loading and summer function of each lagoon. The results indicated that Moran Lake had very high concentrations of phytoplankton when the lagoon was closed, with a low diversity of plankton consisting of 85% Pyrrhophytes, 13% Chrysophytes and 2% Cryptomonads. The predominant aquatic plant community is composed of submerged aquatic vegetation. A preliminary habitat conditions’ ranking indicated that Moran is impaired as a result of reduction in surface area, reduction in summer inflows, urbanization in the watershed, substrate complexity, and excessive algae. Due to funding limitations, Moran Lake was not one of the five lagoons selected for further study under this project.
4.3. Water Quality Monitoring
Baseline water quality monitoring was undertaken as part of this study effort. Over a five-month period from June 2003 through October 2003, field measurements were taken at several locations in and upstream of the lagoon. In late October 2003 additional water samples were gathered after a significant rainfall event for general minerals, bacteria, nutrients, and trace metal concentrations. In November sediment samples were collected at several of the water sampling sites and analyzed by Toxscan and Soil Control Laboratories in Watsonville, California (both state certified laboratories). Water samples were analyzed by the Santa Cruz County Environmental Health Agency’s Water Quality Laboratory for general minerals, bacteria, nutrients, and trace metal concentrations. Sediment samples were analyzed for trace metals, persistent pesticides, hydrocarbons and nutrients.
The objectives of the water quality monitoring included:
- Establishing current baseline water quality conditions in the lagoon that can be compared to historical data and to other environmental criteria data to assess the general health of the lagoon;
- To ascertain how and why water quality changes, both spatially and temporally in the lagoon; and
- To guide future monitoring efforts.
The following sections provide a description of the program methods and a summary of the results and field observations.
4.3.1. Methodology
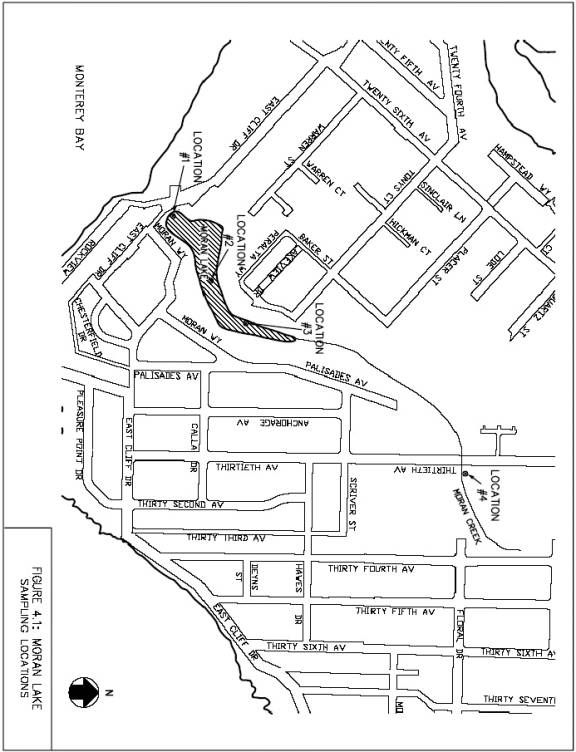
Monitoring and Sampling Locations. The consulting team in consultation with the Santa Cruz County Environmental Health Laboratory, selected four locations for regular water quality and sediment sampling. Three locations are within the lagoon and one is upstream of the lagoon in Moran Creek, as shown in Figure 4.1. The sampling locations are described as follows:Site 1. Site 1 is located immediately upstream of the box culvert at the lagoon inlet.
Site 2. Site 2 is located ten feet from the west shore of the lagoon, approximately 420 feet north of the box culvert.
Site 3. Site 3 is located two feet from a storm drain outfall entering the lagoon from Lakeview DriveSite 4. Site 4 is located on Moran Creek east of 30th Avenue, approximately three feet downstream of a culvert which is located between 30th and 34th Avenues, as shown in Figure 4.2.
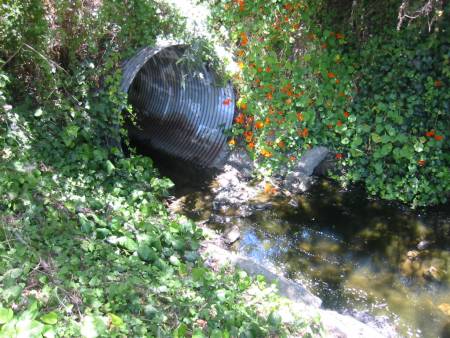
Figure 4.2. Sampling Location #4, Moran Creek East of 30th Avenue
Water Quality Field and Laboratory Tests.Water quality measurements were taken in the field on ten separate events. On five occasions, water samples were also collected for analysis at the Santa Cruz County Environmental Health Lab. Field measurements were collected at one-foot increments throughout the depth of the water column at each sampling location.
Field measures
were conducting using a multi-parameter meter and a portable turbidimeter for
the following parameters:
·
Water Temperature (oC)
·
Dissolved Oxygen
·
pH
·
Conductivity
·
Salinity
·
Turbidity (NTUs).
Five samples collected for laboratory analysis were analyzed for the following parameters:
Total
and Fecal Coliform
Total Suspended Solids
Alkalinity
Chloride
Nitrate-Nitrogen
Ammonia-Nitrogen
Organic-Nitrogen
Total Phosphorus
Total Sulfate
Sodium
Potassium
Magnesium
Calcium
Lead
Copper
Zinc
Grab samples were collected from the lagoon. Careful attention was taken to insure that the samples were not contaminated during sampling process. Samples that contained preservative were filled to just below the bottle lip to ensure no preservative was washed out. Samples were stored on ice (4 oC) during transportation to the laboratory.
On July 8, 2003, samples were collected in the morning and late afternoon to assess and measure diurnal variations in water quality, primarily fluctuations in dissolved oxygen. Water quality samples were also collected during the first flush event of the 2003-2004 water year, on October 31, 2003. The first flush event was defined as the first storm event of the season large enough to generate sheet flow across impervious surfaces in the watershed.
Sediment Quality Sampling.
On November 25, 2003, sediment samples were collected at three locations within Moran Lake. Surface sediment samples were collected with bucket samplers at Sites 1, 2, and 3. At Sites 2 and 3, three soil samples were collected, at the right and left channel banks and one in the center of the channel. The three samples were composited prior to analysis. One additional sample was collected at Site 2 at a depth of six to eight inches below the surface. The samples were analyzed for the following parameters:
·
Trace Metals
·
Polynuclear Aromatic
Hydrocarbons (PAHs)
·
Organochlorine
Pesticides
·
Polychlorinated
Biphenyls (PCBs)
·
Nutrients (nitrogen
and phosphorus species)
·
General Minerals
·
Iron and Manganese
·
Oil and Grease
·
pH and Conductivity
This section provides a summary of the field and laboratory results. For the majority of parameters the results are presented graphically to illustrate the conditions measured either temporally (over time) or spatially (over the an area or depth in the lagoon). In some instances the results are compared to water quality standards or objectives that have been established to assess the potential impacts to water quality.
pH
Specifically, pH is a measure of the activity of hydrogen ions in water, and is defined as the logarithm of the reciprocal of the concentration of free hydrogen ions in a water sample. The pH scale ranges from 1 to 14, where neutral water will have a pH around 7 and a low pH water typically will have a pH of 4.5. The pH of natural waters is generally in the range of 6 and 9. However, in nutrient rich (or euthrophic) ponds or lakes, such as Moran Lake, pH can vary significantly throughout a day to due to photosynthesis and respiration. During the day aquatic vegetation, including algae and aquatic grasses uptake oxygen and release carbon dioxide, which reacts with hydrogen and results in an increase to pH, while during the evening and early morning aquatic plants respire and decompose consuming carbon dioxide and release hydrogen ions back into the water causing the pH to lower. This process is referred to as a diel fluctuation.
pH measurements were taken at the four sampling sites, at a depth of six inches below the water surface on nine events. The field measurements are presented in Table 4.1. pH values were generally within the range of natural waters, ranging from 6.6 to 9.3. The pH values varied spatially across the lagoon and temporally through the sampling period, as shown in Figure 4.3. In general the pH of the lagoon tended to increase as the lake became more eutrophic and saline. When the lagoon sand bar breached and the lagoon was primarily freshwater the pH dropped dramatically.
Table 4.1 pH Field Measurements
A daily fluctuation of pH was observed during a morning and afternoon sampling event on July 8, 2003. Morning and afternoon pH measurements showed diurnal variations of pH, which is attributed to photosynthesis of algae in the lagoon.
Figure 4.3 pH in Moran Lake (June 26, 2003 to October 31, 2003)
Dissolved oxygen (DO) measures the concentration of molecular oxygen dissolved in water. Fish and other aquatic organisms assimilate dissolved oxygen in water through their gills and into their blood, and require a certain quantity of DO in water to survive. DO concentrations in water are dynamic depending on oxygen producing processes such as photosynthesis, and oxygen depleting processes such as respiration and decomposition. DO concentrations fluctuate daily, seasonally, with depth and at locations where physical factors increase water turbulence and water contact with atmospheric oxygen. Photosynthesis occurs near the water surface in the phototrophic zone where sunlight penetrates the water column. Decomposition occurs primarily on the lagoon bottom in the benthic zone where microorganisms decompose organic matter consuming oxygen. The concentration of DO in water is also temperature dependent. Colder water has the capacity to hold more DO than warmer water due to the density and pressure of the liquid.
Eutrophic or highly enriched watercourses, such as Moran Lake will show highly varying levels of DO. During early morning periods DO may be suppressed and very low concentrations, while in the late afternoon DO may be very high due to algae and other aquatic vegetation releasing DO into the water column. Urban pollution and storm water runoff often act to decrease dissolved oxygen concentrations in lake water. Polluted runoff containing degradable organic matter introduced to a water body such as Moran Lake, exert an oxygen demand during the assimilation and decomposition of these waste products. This oxygen demand can deplete DO concentrations, creating unsuitable conditions for aquatic organisms. In natural waters normal DO may fluctuate from 5 to 10 mg/L.
DO measurements were taken at each of the four sampling locations on ten separate events. Measurements were taken from the water surface to the lake bottom in one-foot increments. The DO data are presented in Table 4.2.
Each of the four sampling locations had unique patterns of DO fluctuation, likely related to their position within the lagoon. Figures 4.4.1 through 4.4.4 show the dissolved oxygen concentration measured at the surface and near the bottom of the lagoon at each monitoring site.
At Site 1 (Figure 4.4.1) the dissolved oxygen concentration was relatively constant throughout the water column, but varied significantly over time. During the early summer just prior to the lagoon closing the DO concentrations were relatively low, ranging between 4 to 6 mg/L. However, after the lagoon closed and became highly euthrophic daily DO concentrations increased significantly from mid july through September until the lagoon opened up again. DO concentrations were well above 10 mg/L in proximity to the culvert. DO concentrations were relatively constant at depth, which is attributed to the lagoon being well mixed due to wind action.
Table 4.2 Dissolved Oxygen Concentration (mg/L) Measurements
At Site 2 the dissolved oxygen concentrations at the surface and near the lagoon bottom tended to vary seasonally. Eight of the ten sampling events showed a decrease in dissolved oxygen concentration with depth. During the summer months, when the lagoon was closed to tidal flushing and had limited freshwater flows the dissolved oxygen at the surface was typically higher at the surface than near the bottom. The stratification of DO with depth at this location is likely influenced by surface photosynthesis of algae and decomposition of organic material on the lagoon bottom. This condition was also observed at Site 3 where DO at the bottom of the lagoon was less than 1 mg/L on several occasions, as shown in Figure 4.4.3. Urban runoff likely contributes sediments, surfactants, oil and grease from adjacent urban areas, which can effect DO concentrations. During the first flush event in later October the DO concentration increased substantially at Site 2 and on the surface at Site 3, as a result of highly aerated runoff entering the lagoon.
Figure 4.4.4. shows the DO concentration measured in Moran Creek upstream of the lagoon. DO at Site 4 in Moran ranged from 8.2 to 12.85 mg/L. Shallow water depths prevented multiple depth sampling at this location. Compared to the other sampling locations the DO concentrations at Site 4 were generally higher. The observed DO concentrations were likely influenced by turbulent flow conditions in the stream immediately upstream of the monitoring point.
Figure 4.4.1 Dissolved Oxygen Concentrations at Lagoon Inlet (Site 1)
Figure 4.4.2 Dissolved Oxygen
Concentrations at Site 2
Figure 4.4.3 Dissolved Oxygen Concentration at Site 3
Figure 4.4.4 Dissolved Oxygen Concentration in Moran Creek
Figure 4.5 Morning and Afternoon Dissolved Oxygen Concentrations at Site 3
On July 8, 2003 DO measurements were conducted in the morning and afternoon at all four sampling locations. DO concentrations measured during the morning were less than recordings taken in the afternoon, as shown in Figure 4.5. The increase in DO during the daylight hours is a result of oxygen production by photosynthetic algae in the water column. Low or depressed DO concentrations results from the high DO demand exerted by the substantial algal blooms occurring in the lagoon, which is expected under highly euthrophic conditions that are present in the lagoon.
Temperature
At Moran Lake, temperature measurements were taken at each of the four sampling locations, from the water surface to the lake bottom in one-foot increments on ten separate monitoring events. As expected, water temperature generally increased from July to early September and began to decrease in late September and October (Table 4.3). Water temperature within the lagoon was generally higher (between five to ten degrees) in the lagoon than at Site 4 in Moran Creek, as shown in Figure 4.6. The increased temperature in the lagoon is likely the result of the high heat capacity of the lagoon resulting from the thick biomass in the water column, combined with shallow water depths. Figure 4.6 also shows a daily increase in water temperature, observed on July 8, 2003 during a morning and afternoon sampling event.
Table 4.3 Temperature Field Measurements (Degrees Centrigrade, oC)
Figure 4.6 Water Temperature (Degrees oC) Measured at Sites 1 and Site 4
Nutrients
Water samples were collected and analyzed by the Santa Cruz County Environmental Health Water Quality Laboratory for soluble nutrients including: organic-, ammonia- and nitrate-nitrogen, and total phosphorus.
Nitrogen and phosphorus at low levels are important nutrients in aquatic ecosystems. However, at elevated levels these constituents can result in excessive, invasive and some times noxious characteristics that lead to euthrophic and anoxic conditions in a lagoon system. Sources of nitrogen and phosphorus include storm water runoff, organic matter, lawn fertilizers, leaking sewer pipes and/or domestic animals. Natural nutrient sources include the decomposition of organic debris delivered to surface water bodies during storm events.
Over the course of the study, nutrients were measured on five separate monitoring events at each of the four sampling locations. The results are presented in Table 4.4.
Table 4.4 Nutrient (Nitrogen and Phosphorus) Measurements (in mg/L)
Nitrate-N (NO3-) concentrations at the four sampling locations ranged from less than the reporting limit, 0.01 mg/L, to 1.7 mg/L. Ammonia-N (NH3) concentrations at the four sampling locations ranged from less than the reporting limit, 0.04 mg/L, to 0.74 mg/L. Organic-N concentrations at the four sampling locations ranged from 0.68 mg/L to 8.8 mg/L. Total phosphorus concentrations at the four sampling locations ranged from less than the reporting limit, 0.05 mg/L, to 0.9 mg/L.
The highest concentrations of total phosphorus, nitrate-N (NO3-), ammonia-N (NH3), and organic-N were measured during the first flush sampling event on October 31, 2003. The concentrations are significantly higher than those measured on October 28, 2003, just three days before the first significant rainfall event of the season, as shown at Site 2 in Figure 4.7. The increased concentrations are likely a result of urban pollutants, such as waste products and lawn fertilizers, which were transported into the lagoon by storm water runoff.
Figure 4.7 Nutrient Concentrations at Site 2 on October 28 and October 31, 2003
Total and Fecal Coliform Bacteria
Water samples were collected from each monitoring site and analyzed for total and fecal coliform bacteria. Total and fecal coliform bacteria are indicator organisms routinely used to test the quality of surface and drinking water sources. Testing for these organisms are relatively easy, inexpensive and provide a good indication of the level of pollution that may occur in a water body.
The total coliform bacteria group includes a large group of bacteria that can occur naturally in soils and water or in wastes from animals. Fecal coliform is a subgroup of bacteria that live in the intestines and waste material, or feces, excreted from warm-blooded animals. When fecal coliform bacteria are present in high numbers (greater than 200 colonies/100 milliliters of water sample) it means the water may contain fecal matter from a wide variety of animals including waterfowl, domestic and wild animals and humans, and may be unsafe for direct contact. Although coliform bacteria may not be pathogenic, the presence of these organisms may indicate the potential presence of other disease carrying organisms.
In an urban setting sources of fecal coliform are many, including storm runoff carrying waste from domestic and wild animals, decaying vegetation, organic sediment, leaking sanitary sewers, and water fowl that may reside in the stream or lagoon.
The Santa Cruz County Environmental Health Lab analyzed water samples for total and fecal coliform bacteria. Samples were taken at each of the four sampling locations and are reported in units of colony forming units per 100 milliliters of water sample (CFUs). Total coliform counts ranged from 4 CFUs to ‘too numerous to count’, and fecal coliform counts ranged from less than 1 to 11,470 CFUs.
Table 4.5 Total and Fecal Coliform Measurements
The highest total and fecal coliform counts were recorded during the first flush sampling event on October 31, 2003, and the highest values on that day were recorded at Site 1, as shown in Figure 4.8. Site 1 receives storm water runoff from Moran Creek as well as from a storm drain outlet under East Cliff Drive, which likely contributed to the increased fecal coliform counts at this location. The highest counts prior to October 31, 2003, sampling events, were recorded at Site 4 in Moran Creek, as shown in Figure 4.8 for samples collected on August 12, 2003.
Figure 4.8 Results of Fecal Coliform Counts on August 12 and October 31, 2003
Total Suspended Solids and Turbidity
Total Suspended Solids
Water samples were also analyzed for total suspended solids (TSS), which is the concentration of solids suspended in water. These solids can be either mineral or organic (e.g. soil or algae) matter. A high concentration of TSS can adversely impact water quality by blocking light transmittance through water and adversely affecting photosynthesis and primary production in a lake, and can result in direct impacts to aquatic life by clogging or injury to fish gills and smothering benthic organisms on the lagoon bottom. Suspended solids can also transport attached pollutants, including metals and hydrocarbons in runoff, potentially increasing concentrations of these components within a water system. >
TSS values can increase as a result of high-energy runoff that has eroded soil and transported soil and other debris into a water system. TSS also increases as a result of seasonal algae growth, which can be caused by warm temperatures or a release of nutrients from the decomposition of organic material.
The Santa Cruz County Environmental Health Lab analyzed three water samples collected at each sampling site for total suspended solids. Two samples were collected during the summer months when the lagoon was closed and a third sample was collected during the first flush event in late October. Turbidity results are presented in Table 4.6. The measured concentrations of total suspended solids ranged from 2.0 mg/L to 92.0 mg/L.
Table 4.6 Turbidity (in NTU) and Total Suspended Solids (in mg/L) Measurements
Samples collected during the summer months, June and July, represent conditions during which the majority of TSS is algae floating in the water column. During this period the TSS concentrations ranged from approximately 5 mg/L to 35 mg/L. Samples collected in October during the first flush event had substantially higher TSS concentration ranging from 60 to 92 mg/L. The higher TSS concentrations are attributed to storm water runoff entering the lagoon from Moran Creek, local drainage and East Cliff Drive. Figure 4.9 shows the results of three representative sampling events collected from the four sampling sites within Moran Lake and analyzed for TSS.
Figure 4.9 Total Suspended Solids Concentrations
Turbidity
Turbidity is an indirect measurement of suspended matter in water. The turbidity test measures the amount of light scattered through a sample of water. The presence of suspended matter or clay particles will tend to scatter focused light beam that is directed through a given thickness of water. A light sensor detects the amount of scatter and converts this intensity to a unit of transmittance, which is roughly approximated to the amount of suspended matter in the water. Generally, a high turbidity value indicates a high concentration of total suspended solids (however, in some instances there may be no direct correlation particularly if there is a high concentration of organic acids that may absorb the light in the water resulting in a low reading). Typically a high concentration of suspended solids increases the scatter of light and increases the turbidity value, and a low concentration of solids allows the light to pass through the water with little scatter.
At Moran Lake, turbidity measurements were taken from samples collected at each of the four sampling locations on ten sampling occasions. Turbidity was measured in the field and reported in Nephelometric Turbidity Units (NTU), and the results are presented in Table 4.6. The recorded turbidity measurements at the four sampling locations for the ten sampling events ranged from 0.2 to 43.1 NTU.
Turbidity measurements across the four sampling sites did not vary significantly, though overall Site 3 appeared to have higher readings than the other two locations. Site 3, in the upper lagoon, could have higher turbidity measurements due to the accumulation of organic debris at this location as well as the proximity to a storm drain outfall. The highest turbidity measurement at each sampling location was recorded during the first flush sampling event. The high readings occurred because of high energy storm water flows that introduced suspended sediments into the lagoon and also re-suspended sediment and organic debris from the lagoon bottom. Figure 4.10 shows the results of turbidity measurements collected from the four sampling locations on August 12, 2003, which depicts the increased readings at Site 3 during the summer months, and the increased turbidity measurements observed during the first flush on October 31, 2003.
Figure 4.10 Turbidity Measurements taken on August 12th and October 31st 2003
Salinity and ConductivitySalinity
Salinity measures the concentration of salt in water, and is generally reported in parts per thousand (ppt). Ocean water has a salinity of approximately 35 parts per thousand. Water with salinity levels in excess of ocean water is referred to as hyperhaline or hypersaline, depending upon if the salts are ocean or land derived. (Hyperhaline. Term used to characterize waters with salinity greater than 40 ppt (parts per thousand) due to ocean-derived salts. Hypersaline. Term used to characterize waters with salinity greater than 40 ppt due to land-derived salts (Cowardin et al. 1979).) Water with concentrations greater than ocean water is generally observed within enclosed water bodies where the effects of evaporation increase salt concentration as water evaporates and salts accumulate.
When salinity levels in Moran Lake exceed ocean water, the system can be characterized as hyperhaline as the salts in Moran Lake are ocean derived. Hyperhaline conditions in Moran Lake limit biological diversity and impact aquatic biota within the lagoon as salts accumulate and salinity levels increase above tolerable limits.
Salinity measurements were taken at each of the four sampling locations, from the water surface to the lake bottom in one-foot increments. Salinity measurements were taken on ten sampling events, as shown in Table 4.7. The recorded salinity measurements at the four sampling locations ranged from 0.3 to 36.5 parts per thousand (ppt).
Salinity in the lagoon increased from June to October, when the lagoon opening was closed and evaporation increased salt concentrations in the lagoon. The highest salinity measurements were recorded in August and September, and were in excess of 35 ppt, approaching hyperhaline conditions. Figure 4.11 shows increasing salinity measurements taken on the surface of the lagoon at Site 1. Salinity decreased rapidly during the first flush, when high freshwater flows entered the lagoon from Moran Creek. The decreased salinity on this date was recorded due to the freshwater lens formed on the surface of Moran Lake from Moran Creek and other surface water drainages adjacent to the lagoon that contribute storm water runoff.
Salinity measurements taken at the surface were generally less than measurements taken at depth within the lagoon. This phenomenon indicates that a warm wedge of saltier water forms in the deeper water in the lagoon. At the beginning of the sampling, in June, salinity measurements were generally uniform across the entire lagoon. Beginning in August and continuing into October, the salinity measurements generally decreased from the lagoon inlet towards the upper lagoon. All salinity measurements taken at Site 4 were less than or equal to 0.5 ppt, indicating the site was measuring freshwater flows from Moran Creek and is above any salinity influences from the lagoon. Figure 4.12 shows surface water salinity measurements collected during three sampling events within the lagoon at Sites 1, 2, and 3, showing the trend towards decreasing salinity in the upper lagoon during late summer.
Table 4.7 Salinity Field Measures (in parts per thousand, ppt)
Figure 4.11 Salinity Measurements Collected at Site 1
Figure 4.12 Salinity Measurements on June 5th, July 25th , September 30th , 2003
Electrical ConductivityElectrical conductivity is the measure of a water samples ability to conduct an electrical current, and is reported in units of micromhos or microsiemens (mS). The electrical conductivity of water increases as the concentration of ions (charged particles) increases. For example pure water has a very low electrical conductivity, whereas ocean water with high sodium and chloride concentrations has a high electrical conductivity. The complexity of natural waters very rarely provides direct estimates of ion concentrations from electrical conductivity measurements.
At Moran Lake, electrical conductivity measurements were taken at each of the four sampling locations, from the water surface to the lagoon bottom in one-foot increments. The results are presented in Table 4.8. The recorded salinity measurements at the four sampling locations ranged from 0.105 to 53.5 mS.
The lowest electrical conductivity measurements were recorded at Site 4, in the freshwater of Moran Creek. The highest measurements were recorded during August and September at Site 1, where near-hyperhaline conditions were observed. Very little variation in electrical conductivity measurements between each of the three sampling locations within the lagoon was observed. Electrical conductivity measurements did generally increase with depth at each of the sampling locations within the lagoon, another indication of the warm lens of saltier water on the lagoon bottom. Figure 4.13 shows the transition of salinity and conductivity measurements with depth collected from Site 2 on October 31, 2003.
Table 4.8 Conductivity Field Measurements (in micron siemens, mS)
Figure 4.13 Salinity and Conductivity Measurements at Site 2 on October 31st 2003.
General Minerals
General mineral analyses were completed on four rounds of testing conducted in June, July and October, as shown in Table 4.9. The first three rounds of testing were completed when the lagoon was closed and the last sample was collected during the first flush event at the end of October 2003. The results clearly indicate that during the summer months the lagoon is filled primarily with salt water and the major ions in solution include chloride and sodium. During the first flush event that occurred on October 31, 2003, the water quality in the lagoon shifted significantly to represent freshwater conditions.
Table 4.9 General Mineral Analysis
On three occasions during the study period water samples were collected and analyzed for lead, copper and zinc. The results are presented in Table 4.10. The concentration levels for trace metals were very low for all three metals tested for during June and July. The highest concentrations were routinely detected in the samples collected from Moran Creek, which receives dry weather runoff from urbanized areas. Dry weather runoff includes runoff resulting from street and driveway, and constructed related washing activities, residents washing cars, over spray from landscape irrigation systems. From these sources, dust laden with trace metals typically from tire wear and atmospheric deposition is washed into drainage ways, such as Moran Creek. The last sample was collected in late October during the first significant rainfall event (>0.5 inches of rain) or commonly referred to as the "first flush" event.
During the summer months the total metals concentrations was very low in the two rounds of testing conducted. The highest concentrations measured over the course of the study occurred in Moran Creek, which is attributed to urban runoff. Samples collected during the first flush event were also significantly higher than samples collected during the summer or dry period.
The test results have been compared to several water quality criteria to determine if the concentrations pose a threat to fresh and marine aquatic life. The State of California and the U.S. Environmental Protection Agency (EPA) have set different criteria for total metals concentrations, which are summarized below. In addition, the toxicity of copper, lead and zinc is also a function of the water hardness: in hard water the metal is less biologically available or toxic to aquatic life, and in softer water the metals may be more toxic at lower concentrations. Table 4.11 presents water quality criteria set forth in the California Toxics Rule (CTR), prepared by EPA. Different concentration values are a function of the water hardness calculated for the different water samples tested.
Table 4.10 Total Copper, Lead and Zinc Concentrations (all in units ug/L)
Table 4.11 California Toxics Rule (US EPA Water Quality Criteria) for the Protection of Freshwater and Saltwater Aquatic Life
Table 4.12 presents water quality objectives established in the California Regional Water Quality Control Board’s Water Quality Control Plan (Basin Plan) for the Central Coast Region. The Basin Plan objectives include ambient water quality objectives to protect both fresh and marine life. The Basin Plan also encompasses water quality objectives established by the State’s Ocean Plan.
Comparing the test results to the different criteria indicate that during the first flush event, all three metals were measured at concentrations that exceed several criteria. Total copper concentrations were measured in Moran Creek and at two locations in the lagoon at levels that exceeded both acute toxicity (1-hr average) and chronic toxicity (4-day average) criteria established by the CTR and Basin Plan objectives established to protect both fresh and saltwater aquatic life. Total lead concentrations were measured during this event at levels that exceeded the CTR chronic criteria. Total zinc concentrations measured during the first flush event exceeded both acute and chronic toxicity levels at all sample locations in the creek and lagoon. The test results indicate that runoff from urbanized areas in the watershed discharge significant and potentially toxic levels of copper and zinc to Moran Lagoon.
The total concentration of zinc is typically what has been found in runoff collected in other urban areas throughout the United States. Table 4.13 compares the total concentration of copper, lead and zinc to test results Copper concentrations were also comparable to average concentrations encountered in National Urban Runoff Pollution studies undertaken by the U.S. Environmental Protection Agency in the 1980’s. Lead concentrations are substantially lower than what has been measured in other earlier studies in the Lagoon and nationwide, suggesting either the increased use of unleaded fuels has reduce the concentration of lead in runoff or runoff entering the creek and lagoon are substantially diluted. Based on the concentration of zinc and copper detected, the results suggest that runoff is not well diluted in the creek or lagoon and that the water in the lagoon is primarily urban runoff.
Table
4.12 Water
Quality Objectives from the Central Coast Region
Water
Quality Control Plan
Table 4.13 Comparison of Moran Creek and Lagoon Water Quality
to
Urban Runoff Water Quality in Other Areas
Four sediment samples were collected at three locations within Moran Lake on November 25, 2003, and analyzed for a combination of metals, polynuclear aromatic hydrocarbons, organochlorine pesticides, organophosphorus pesticides, polychlorinated biphenyls (PCBs), total ammonia as nitrogen, total sulfides, and oil and grease. Three samples were collected at the surface of the bottom of the lagoon and a fourth sample was collected approximately six (6) inches below the bottom of the lagoon bottom. The test results are summarized in Table 4.14.
General Parameters.
All four samples were analyzed for total ammonia and sulfide. One sample was analyzed for oil and grease. The test results indicate that all four samples were in a reduced and anaerobic condition with high concentrations of total ammonia and sulfide. The results also indicate that the sample collected closest to the confluence of Moran Creek and the lagoon contained a relatively high concentration of oil and grease, which is attributed to the discharge of polluted urban runoff entering the lagoon.
Metals.
All four sediment samples were analyzed for total concentration of chromium, copper, lead, mercury and zinc. The severity of contamination with heavy metals can be evaluated by comparisons to sediment quality benchmarks that indicate which concentrations are expected to pose a potential threat to the ecosystem. Table 4.14 shows the Moran Lake concentrations alongside several sediment quality benchmarks. The benchmarks are considered guidelines for evaluation of potential risk, rather than levels that require action. These benchmarks include the following:
· National Oceanic and Atmospheric Administration (NOAA) Effects Range low (ERL) and Effects Range Median (ERM). ERL: concentrations above which adverse biological effects may be expected 10% of the time. ERM: concentrations above which adverse biological effects may be expected 50% of the time.
· Ontario sediment quality guidelines (established by the Ontario Ministry of Environment and Energy) including lowest effect levels (LEL), levels that could affect the most sensitive 5% of the species, and severe effects levels (SEL) in which 95% of the species could be effected.
The concentration of the all metals tested in near surface sediments from Moran Lake are well below the reported Sediment Quality Benchmark values shown in Table 4.14. The data indicates that the metal concentrations in the surface sediments are at levels that are not potentially toxic to benthic organisms.
Table 4.15 compares the recent metals data with historical sediment data collected from Moran Lake in 1976 and 1980. Additional sediment data is also provided for comparison from the Crandall Creek Demonstration Urban Stormwater Treatment (DUST) Marsh in Alameda County and several San Francisco Bay Area streams, flood control channels, and natural wetlands. These data are also presented in Table 4.15. Comparing the 2003 sediment data to the earlier test results indicate that chromium concentrations appear to have increased, but the concentration is relatively low compared to other urbanized watersheds in the Bay Area. Lead concentrations measured in 2003 appear to be slightly lower than those measured in 1980, which was lower than concentrations measured in 1976. Mercury concentrations appear to have increased in 2003, as compared to results tested in 1976; however, the higher concentration may be attributed to better analytical methods and levels of detection. Metal concentrations detected in Moran Lake samples are relatively lower than sediment collected from other streams and wetlands in the San Francisco Bay.
Polycyclic Aromatic Hydrocarbons (PAHs).Two composite sediment samples were analyzed for polycyclic aromatic hydrocarbons (PAHs). The results of the test detected the presence of several PAHs, which are shown in Table 4.14. PAHs are formed during the burning of oil, gas, wood, and other organic substances. They are also present in coal tars, and petroleum products, such as creosote and asphalt. PAHs are ubiquitous environmental contaminants, and one particular PAH, benzo(a)pyrene, is considered an indicator of such contamination because it usually occurs in mixtures of PAHs (WWF, 1997). The likely sources of PAHs in the Moran Lake watershed are from roads, parking lots and vehicle service areas.
Many PAHs, such as benzo(a)anthracene, benzo(a)pyrene and chrysene, are carcinogenic, causing tumors in fish and other animals, and are acutely toxic to some organisms. Noncarcinogenic PAHs, such as fluoranthene, phenathrene, and pyene, are also toxic to some organisms (MacCoy and Black, 1998). Concern about PAHs initially focused on their ability to cause cancer, but more recently concern has turned to their interference with hormone systems and their potential effects on reproduction, as well as their ability to depress immune function (WWF, 1997). A particular concern is the effects of PAHs on egg production in fish, and their potential effects on the early life stages of many aquatic organisms that reside in the surface microlayer of the bottom of many wetlands and lagoons, where PAHs can become concentrated.
Comparing the PAH concentrations with different sediment quality benchmarks indicate that the phenanthrene, chrysene, benzo(a)anthracene and benzo(a)pyrene exceed criteria established by the British Columbia Ministry of Water, Land and Air Protection for protection of freshwater organisms, as shown in Table 4.14. The total concentration of PAHs is elevated, but is below the low and median effects levels established by the National Oceanic and Atmospheric Agency (NOAA). Based on the more conservative and contaminant specific criteria established by British Columbia, the levels of PAHs detected in the sediment may cause impairment to benthic organisms in the lagoon.
Organochlorine Pesticides.Two sediment samples were tested for organochlorine (OC) pesticides. The test results detected chlordane. The presence of chlordane in Moran Lagoon sediments after being banned since 1980 appears to reflect either the slow movement of this persistent pesticide through groundwater to the lagoon, or the erosion of contaminated soils. Chlordane is still found in groundwater and storm water samples in most environments where it has been tested for, albeit at low levels (Scheuler, T.S and H. K, Holland, 2000). Chlordane was widely used as a residential fumigant in the 1960’s and 1970s.
Most OC pesticides have been banned or restricted because of potential human and wildlife health effects, tendency to bioaccumulate, and ability to persist in the environment (Wong, Capel and Nowell, 2000). In general, OC pesticides have moderate to high chronic toxicity, and are associated with development and/or reproductive effects in animal studies. OC compounds are also very toxic to aquatic organisms.
The sediment test results detected total chlordane levels well above the probable and threshold effects levels established by several agencies, as shown in Table 4.14. The results indicate that the residual and persistent chlordane levels in lagoon sediments may impair aquatic life in the lagoon
PCBs, DDT derivatives, and other organic chemicals were not detected in the samples tested.
Table 4.14 Sediment Quality Test Results - November 25, 2003
Table 4.15 Comparison of Moran Lake Sediment Quality to Other Areas
4.4. Summary of Findings
1. Eutrophic and hyperhaline conditions in Moran Lake have been well documented since the mid 1970’s. Several factors are contributing to this including poor circulation and flushing during the summer months and nutrient rich runoff entering the lagoon from urbanized lands.
2. Historical and recent testing continue to detect high concentrations of fecal coliform bacteria indicating the lagoon is receiving contaminated runoff from the surrounding urbanized areas. Although historic testing may have indicated sewage overflows from the treatment plant that once existed at Lode Street, it is likely that present coliform contamination comes from multiple sources, including domestic animals, leaking sewers, and wildlife (most notably water fowl) residing in the lagoon or riparian corridor.
3. A reduction in lagoon surface area and volume has diminished the ability of Moran Lake to dilute and treat contaminants.
4. In general the pH of the lagoon tended to increase as the lake became more eutrophic and saline. When the lagoon sand bar breached the pH dropped dramatically when the lagoon was primarily freshwater.
5. Eutrophic or highly enriched watercourses, such as Moran Lake show highly varying levels of dissolved oxygen (DO). During early morning periods DO is suppressed with low concentrations, while in the late afternoon DO may be very high due to algae and other aquatic vegetation releasing DO into the water column. Urban pollution and storm water runoff act to decrease dissolved oxygen concentrations in lake water. Polluted runoff containing degradable organic matter introduced to a water body such as Moran Lake, exert an oxygen demand during the assimilation and decomposition of these waste products. This oxygen demand can deplete DO concentrations, creating unsuitable conditions for aquatic organisms.
6. Water temperatures were relatively uniform throughout the lagoon and were generally higher (between five to ten degrees) than surface water entering the lagoon from Moran Creek. Due to the shallow conditions in the lagoon water temperatures did not vary significantly from the surface to the bottom of the lagoon, which would normally occur in a natural and unfilled coastal lagoon. The increased temperature results from the high heat capacity of the lagoon resulting from the thick biomass in the water column, combined with shallow water depths.
7. The highest concentrations of total phosphorus, nitrate-N (NO3-), ammonia-N (NH3), and organic-N were measured during the first flush sampling event on October 31, 2003. These nutrient concentrations are significantly higher than those measured on other occasions. The increased concentrations are a result of urban pollutants, such as waste products and lawn fertilizers, which were transported into the lagoon by storm water runoff.
8. Total suspended solids measurements completed during the summer and early fall shows how the character of the lagoon water quality is distinct in these two periods. Samples collected during the summer months of June and July represent conditions during which the majority of TSS is algae floating in the water column. During this period the TSS concentrations ranged from approximately 5 mg/L to 35 mg/L. Samples collected in October during the first flush event had substantially higher TSS concentration ranging from 60 to 92 mg/L, which was composed primarily of fine inorganic suspended solids, which are attributed to storm water runoff entering the lagoon from Moran Creek and local Lake drainage sources.
9. Salinity in the lagoon increases from June to October, when the lagoon tidal inlet closes and evaporation increases salt concentrations. The highest salinity measurements were measured in August and September, and were in excess of 35 ppt, approaching hyperhaline conditions. Salinity levels in the lagoon decreased rapidly during the first flush, when high freshwater flows entered the lagoon from Moran Creek, further demonstrating that the volume and dilution capacity of the lagoon is very small relative to the watershed drainage area.
10. General mineral analyses conducted in June, July and October clearly indicate that during the summer months the lagoon is filled primarily with salt water and the major ions in solution include chloride and sodium. During the first flush event, the water quality in the lagoon shifted rapidly to represent freshwater conditions.
11. The concentration of trace metals varied significantly both spatially and seasonally. During the summer months the trace metals concentration was very low for all three metals tested (copper, lead and zinc) in the lagoon and Moran Creek. However, the highest concentrations during this period were routinely detected in the samples collected from Moran Creek which receives dry weather runoff from urbanized areas. Dry weather runoff includes runoff from streets and driveways, construction- related washing activities, car washing, and over spray from landscape irrigation systems. A sample collected in late October during the first significant rainfall event ("first flush" event) contained significantly higher concentrations of these metals, which could adversely affect aquatic organisms.
12. Comparing the test results to the different water quality criteria indicate that during the first flush event, all three metals were measured at concentrations that exceed several criteria. Total copper concentrations were measured in Moran Creek and at two locations in the lagoon at levels that exceeded both acute toxicity (1-hr average) and chronic toxicity (4-day average) criteria established by the California Toxic Rules (CTR) and Water Quality Control Plan for the Central Coast Region, established to protect both fresh and saltwater aquatic life. Total lead concentrations were measured during this event at levels that exceeded the CTR chronic criteria. Total zinc concentrations measured during the first flush event exceeded both acute and chronic toxicity levels at all sample locations in the creek and lagoon. The test results indicate that runoff from urbanized areas in the watershed discharge significant and potentially toxic levels of copper and zinc to Moran Lagoon.
13. The total concentration of zinc is typically what has been found in runoff collected other urban areas throughout the United States. Copper concentrations were also comparable to average concentrations encountered in National Urban Runoff Pollution studies undertaken by the U.S. Environmental protection Agency in the 1980’s. Lead concentrations are substantially lower than what has been measured in other earlier studies in the Lagoon and nationwide, suggesting either the increased use of unleaded fuels has reduced the concentration of lead in runoff or runoff entering the creek and lagoon are substantially diluted. The concentration of zinc and copper suggests that runoff is not well diluted in the creek or lagoon and that the water in the lagoon is primarily urban runoff.
14. The concentration of the all metals tested in near surface sediments from Moran Lake are below reported Sediment Quality Benchmark values indicating that the metal concentrations in the surface sediments are at levels that are not potentially toxic to benthic organisms.
15. Comparing the 2003 sediment data to the earlier test results indicate that chromium concentrations appear to have increased, but the concentration is relatively low compared to other urbanized watersheds in the San Francisco Bay Area. Lead concentrations measured in 2003 appear to be slightly lower than those measured in 1980, which was lower than concentrations measured in 1976. Mercury concentrations appear to have increased in 2003, as compared to results tested in 1976; however, the higher concentration may be attributed to better analytical methods and levels of detection.
16. Metal concentrations detected in Moran Lake sediment samples are relatively lower than sediment collected from other streams and wetlands in the San Francisco Bay Area.
17. Sediment samples detected the presence of several PAHs. Principal source of PAHs is from roads, parking lots and vehicle service areas. Several of the PAH compounds detected are carcinogenic compounds and other compounds are potentially toxic to aquatic life. Comparing the PAH concentrations with different sediment quality benchmarks indicate that the phenanthrene, chrysene, benzo(a)anthracene and benzo(a)pyrene exceed criteria established by the British Columbia Ministry of Water, Land and Air Protection for protection of freshwater organisms. The total concentration of PAHs is elevated, but is below the low and median effects levels established by the National Oceanic and Atmospheric Agency (NOAA). Based on the more conservative and contaminant specific criteria established by British Columbia, the levels of PAHs detected in the sediment may be impairing benthic and other aquatic life in the lagoon.
18. Sediment test results detected total chlordane levels well above the probable and threshold effects levels established by several agencies. The results indicate that the residual and persistent chlordane levels in lagoon sediments may adversely affect aquatic life in the lagoon.